SolarWinds Observability
SaaS-delivered Observability built to extend visibility across cloud-native, on-prem, and hybrid technology stacks.
Complete observability built on decades of experience helping IT professionals
SolarWinds Observability delivers unified and comprehensive visibility for cloud-native, on-premises, and hybrid custom and commercial applications to help ensure optimal service levels and user satisfaction with key business services.
Eliminate tool sprawl and gain comprehensive, single-pane-of-glass visibility with actionable intelligence
Accelerate issue resolution with built-in intelligence and actionable insights driven by data from across the environment
Reduce alert fatigue with AIOps, enhanced with machine learning (ML), and a customized metrics -powered solution designed to automatically prioritize and surface real problems
Accelerate cloud modernization with cloud-native, multi-tenant observability that seamlessly integrates with SolarWinds Hybrid Cloud Observability to deliver a unified view across multi-cloud, hybrid, and on-premises environments
More dev and deployments, less firefighting
Hybrid application performance monitoring
For internally written and commercial applications. Unified code-level troubleshooting with transaction tracing, code-profiling, and exception tracking combined with end user experience insights through synthetic and real user monitoring.
Open-source database performance monitoring
Deep database performance monitoring. Increase system performance, team efficiency, and infrastructure cost savings by offering full visibility into open-source databases including MySQL®, PostgreSQL®, MongoDB®, Azure® SQL, Amazon Aurora®, and Redis®
SaaS-Delivered hybrid network, on-prem and cloud infrastructure monitoring
Our SaaS offering leverages decades of SolarWinds on-premises network and infrastructure monitoring leadership. A hybrid, full stack offering that includes the monitoring of network devices, SDWAN, servers, VMs, and cloud infrastructure and related services.
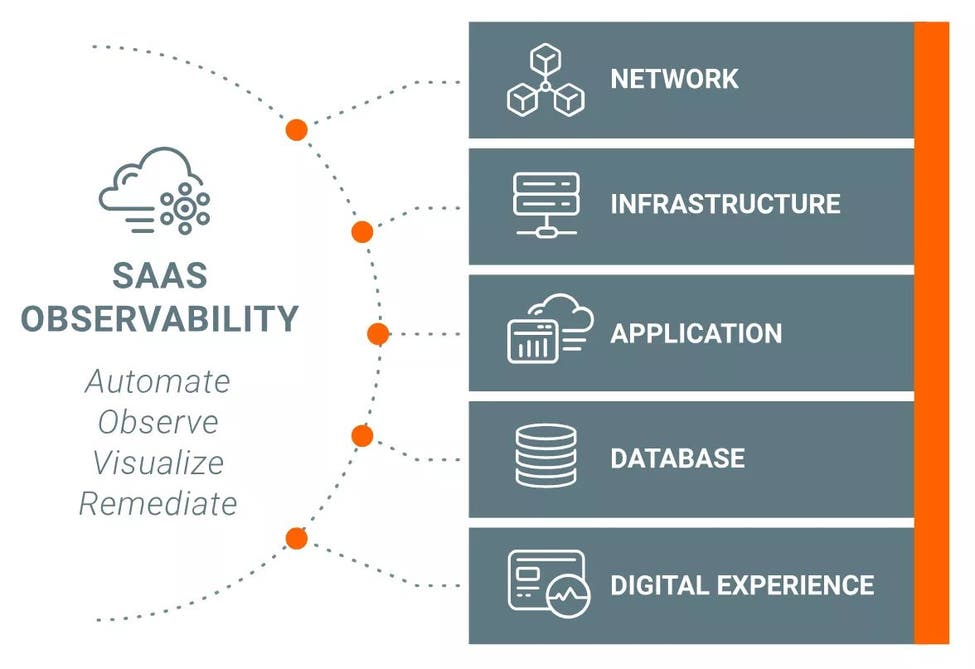
SaaS-Delivered, hybrid, full-stack observability
A versatile solution designed to meet a wide range of use cases. It seamlessly brings together DevOps, IT Ops, and Cloud Ops teams, covering networks, infrastructure, databases, applications, and user experience. Leveraging a native open-source framework and out-of-the-box third-party integrations.
SolarWinds Observability built for DevOps, IT ops, and Cloud Ops teams.
Hundreds of Observability Integrations


Get started with our
SaaS Hybrid Observability